The Anatomy of Air Pollution

The average American loses 2.6 years of life expectancy from air pollution, according to a report on public health policy in The Washington Post. That may seem like a large number, but it represents progress in a world still grappling with the realities of climate change.
“We’ve invested a lot of resources as a society to clean up our air,” said Jason West, PhD, professor of environmental sciences and engineering at the UNC-Chapel Hill Gillings School of Global Public. In an article about a NASA study on clean air policies that he coauthored, he continued, “Those changes have had a real impact, with fewer people dying each year due to exposure to outdoor air pollution.”
Though the United States enjoys a better average on the Air Quality Index (AQI) than many other developed countries, the cleanliness of air varies wildly within regions — even within neighborhoods. These variations can disparately (and fatally) affect the health of Americans living less than a few miles from each other. The health-related effects are often the result of pollutants emitted by common activities, like long-distance travel and use of wood-burning stoves, that people do not connect to severe health complications.
What Is Air Pollution?
Air pollution is the release into the air of pollutants that are unsafe for human and environmental health; these substances are detrimental to varying degrees. According to the Environmental Protection Agency (EPA), there are six major categories of air pollutants that can be found in outdoor air. They are:
- Carbon monoxide: This is a poisonous gas that cannot be seen or smelled. Sources of carbon monoxide are motor vehicle exhaust, tobacco smoke and industrial manufacturing from burning fossil fuels.
- Ground-level ozone: This gas compound is made from three atoms of oxygen. When ozone occurs in Earth’s upper atmosphere, it protects life forms from ultraviolet rays. At the ground level, however, ozone is toxic to breathe. Sources of ground-level ozone include emissions from industrial facilities, utilities and motor vehicle exhaust.
- Lead: This toxic substance is made of fine particles that are dangerous if ingested. Though people typically think of lead being found in water, soil and paint, it also can get into the air from metals processing and aircraft operations. Other sources include waste burning, utilities and battery manufacturing.
- Nitrogen dioxide: This reddish-brown, highly reactive gas comes from the oxidization of nitric oxide. Sources include the manufacturing of fertilizers and motor vehicle and power plant emissions.
- Particulate matter: Also called particle pollution, this is a mixture of solid and liquid particles from dust, dirt, smoke or soot. These particles are so small they can only be detected with a microscope. Common sources are construction sites, unpaved roads, fields, smokestacks and fires.
- Sulfur dioxide: This colorless gas has a pungent odor that makes it easy to detect. It is of great concern because it leads to the formation of other types of sulfur pollutants. Sources include fossil fuel combustion from manufacturing and the use of trains and ships.
How and Why Do We Measure Air Quality?
Air quality is a measure of how clean or polluted the air is in a given space. The concentration of a pollutant is measured from a range of zero to 500, with 500 being the most hazardous. Measuring air quality has two purposes:
To indicate whether it is safe for vulnerable populations to be exposed to outdoor air.
To monitor the effectiveness of emissions policies meant to reduce air pollution.
According to the EPA, the categories of air quality include:
Good: Zero to 50.
Air quality is clean enough that air pollution poses little to no risk.
Moderate: 51 to 100.
Air quality is acceptable but may be of concern for a small number of people, including those who have pre-existing respiratory symptoms.
Unhealthy for sensitive groups: 101 to 150.
It is unlikely that the general population would be affected, but people with respiratory and heart disease are at greater risk. In addition, older adults and young children may be vulnerable to health risks.
Unhealthy: 151 to 200.
Everyone is at risk of adverse health effects. Sensitive groups may experience more intense reactions.
Very unhealthy: 201 to 300.
Everyone is at risk of serious health effects. This level of air quality would require an alert from the National Weather Service to inform nearby residents.
Hazardous: 300 or higher.
The entire population is vulnerable to very serious health risks. This level of air quality would require an alert from the National Weather Service for emergency conditions.
The AQI is updated on a daily basis, and vulnerable populations can check the quality of air in their town before going outside. In addition, federal administrative law requires that cities with a population greater than 350,000 people, known as Metropolitan Statistical Areas, are required to report air quality on a daily basis.
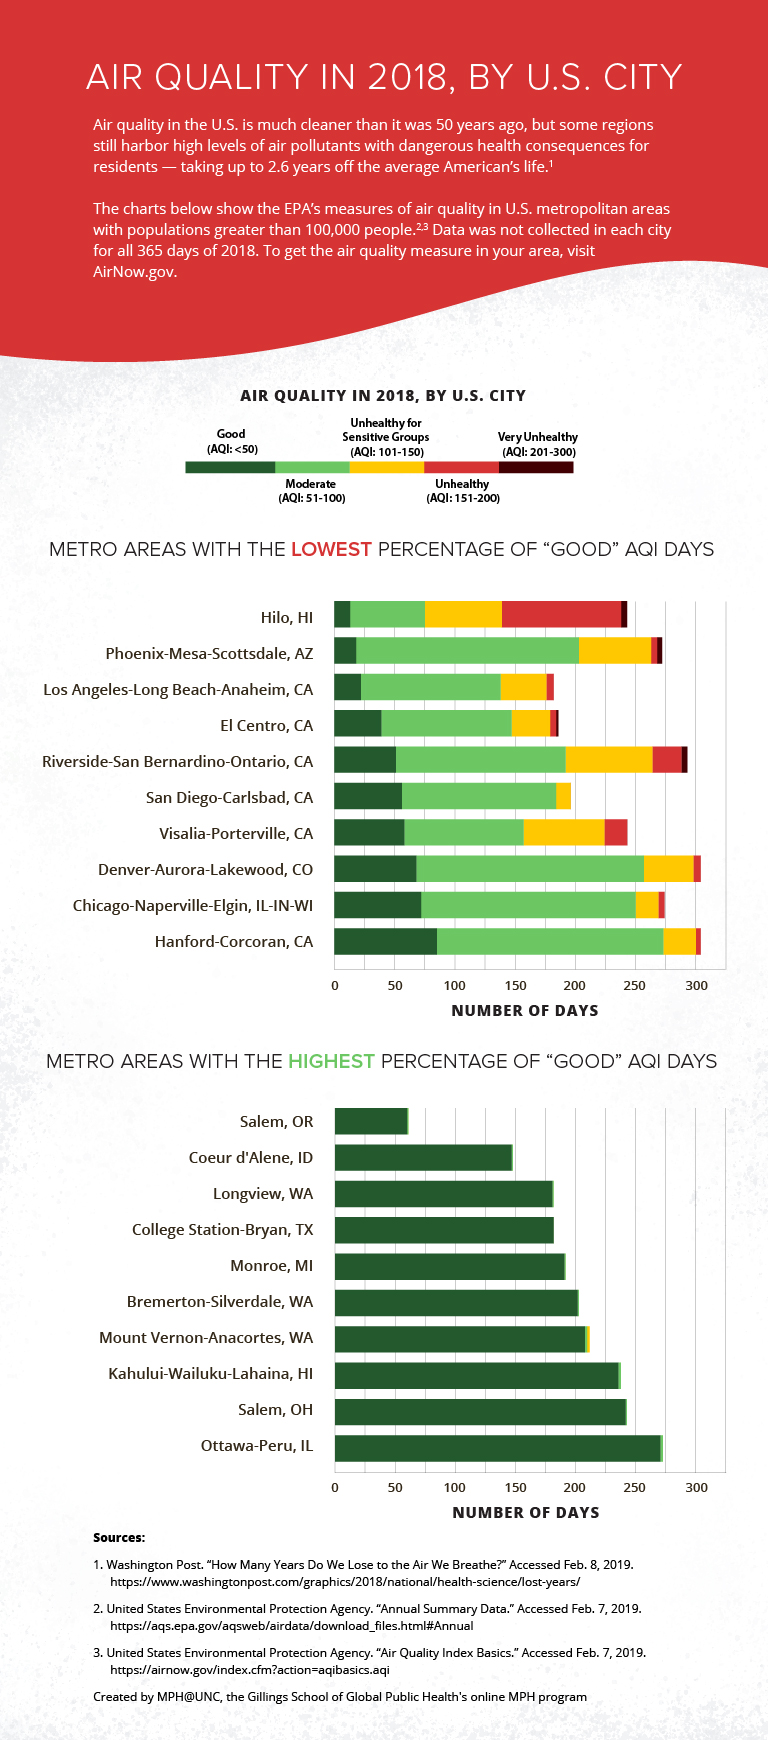
The Environmental Protection Agency’s Air Quality Index measures air quality ranging from “good” to “unhealthy” in metropolitan areas with populations greater than 100,000 people. Data collected from 2018 shows that Hilo, Hawaii, and areas of Arizona had the lowest percentage of “good” AQI days. Salem, Ohio, and areas of Illinois had the highest percentage of “good” AQI days.
Go to a tabular version of “Air Quality in 2018, by City.”
How Does Air Pollution Affect Our Health?
The six categories of pollution defined by the EPA affect health in specific ways.
- Carbon monoxide restricts the flow of oxygen in the bloodstream, which can keep the heart and brain from functioning properly. Breathing carbon monoxide can cause dizziness, unconsciousness and death.
- Ground-level ozone can worsen existing respiratory problems; cause chest pain, coughing, throat irritation and tissue inflammation; and lead to chronic obstructive pulmonary disease (COPD) and other types of lung damage.
- Lead suppresses the nervous system, reproductive system, cardiovascular system, immune system and kidney function by restricting the flow of oxygen in the bloodstream and accumulating in the bones. Pregnant women are at an especially high risk if they are exposed to lead through the air, and young children should be monitored closely for exposure to lead.
- Nitrogen dioxide can cause coughing, wheezing or irritation of the respiratory system. Prolonged exposure to nitrogen dioxide can exacerbate existing respiratory diseases or cause new ones, especially asthma. It can combust with other elements, resulting in particulate matter.
- Particulate matter is so small that it’s easy to inhale without realizing it. Because the particles come to rest deep in the lungs or get absorbed into the bloodstream, particle pollution has been linked to heart and lung disease, asthma and heart attacks. Particulate matter also reduces visibility, which can make it unsafe to exercise or drive outside.
- Sulfur dioxide reacts with other compounds to create particulate matter. When inhaled, these particles can cause respiratory problems such as asthma or lung disease. According to the FDA, some dried fruits contain sulfur dioxide (called sulfites) to extend shelf life. If ingested, this can aggravate existing respiratory problems for people who may be sensitive to the compound.
How Does the Built Environment Affect Air Pollution?
In the context of public health, a person’s built environment has significant effects on the well-being of residents and the community (PDF, 152 KB). The built environment describes the manmade structures and landscapes that dictate the physical activities and social infrastructure of a specific place. This includes buildings, streets, parks, pools and other areas where people live, work and play, according to the Centers for Disease Control and Prevention.
Built environments take many forms but generally can be divided into two main categories: urban and rural. It’s easy to assume that urban environments have more harmful outdoor air pollution because of traffic and energy consumption, but aspects of both urban and rural environments can increase the effects of pollutants.
- Urban environments: Air gets trapped in between buildings, temperatures are higher from energy consumption, and waste can get piled on streets and sidewalks. Common pollutants come from vehicles, garbage, and manufacturing and can settle in water and sewage systems, thereby affecting clean drinking sources and creating drainage issues for densely populated areas.
- Rural environments: Air travels quickly from changing weather patterns, and pollutants spread easily because they are uninhibited by built structures. This means that pollutants can move swiftly from one state to another. Pollutants in rural areas may be condensed by rainfall and settle in large bodies of water, which can negatively impact wildlife health and fresh water sources. Pollution comes primarily from pesticides used in farming, smoke from crop burning, and vehicle emissions from driving long distances.
There are several opportunities to leverage built environments for cleaner air. Using public transportation or electric vehicles can reduce fuel emissions and lessen traffic on the roads. Taking care of existing recreational spaces such as parks and swimming pools helps people to stay active and healthy without endangering wildlife. Learn more about how the built environment affects air quality and public health.
What You Can Do
Protect Yourself from Air Pollution
The Centers for Disease Control and Prevention encourages individuals to protect their bodies in areas that might have unsafe levels of air pollution and offers recommendations about air pollution protection for children, people with chronic conditions and other sensitive groups. Some of their recommendations include:
- Check the AQI on a daily or weekly basis.
- Avoid exercising or spending time outside when the AQI shows unhealthy levels.
- Wear a face mask if AQI levels are unhealthy.
- Work with a health care provider to manage any respiratory risks such as asthma or COPD.
- Protect skin and eyes from absorbing particles by wearing layers and eye protection.
- Frequently replace air filters in your home, school, office, car and other ventilated places. When particle pollution is high outdoors, it can also be high indoors if air filters aren’t up to code.
Reduce Outdoor Air Pollution
Though many U.S. administrative policies already regulate sources of air pollution, individuals can adopt behaviors to minimize their contributions to pollution and help clean the air around them, as is recommended by the EPA.
Behaviors to limit or end include:
- Leaving lights on at home, work and school;
- Using wood for indoor fireplaces — substitute gas or electric logs instead;
- Putting recyclable or compostable items into garbage cans;
- Using single-use utensils and packaging;
- Leaving grills or outdoor fires burning unattended after use; and
- Using paint and cleaning products with harsh chemicals or fumes.
Behaviors to continue or start include:
- Turning yard waste into mulch for gardening or landscaping;
- Putting food waste into compost instead of garbage;
- Sharing a commute by carpooling or using public transportation;
- Inspecting motor vehicles regularly and keeping tires inflated to reduce emissions and particulate matter from tire production and wear;
- Replacing air filters on schedule; and
- Reporting pollution or runoff from construction sites to local government offices.
Not all behaviors immediately improve the environment. It might seem like one reusable jar makes an insignificant difference, but by adding up the waste that otherwise would be destined for a landfill, you may envision how your individual contributions do make a difference in personal and environmental health outcomes.
How to Reduce Air Pollution in Your Community
Public health experts work in many capacities to educate the public and affect policy change. According to the EPA’s information about the Clean Air Act, establishing a dialogue between scientists and communities is a critical part of implementing policies. No matter what field you work in, there are opportunities to advocate for and spread awareness of air quality:
- Conduct research for vulnerable populations.
- Offer educational trainings for local organizations.
- Create awareness campaigns through social media.
- Talk to individual residents by traveling door-to-door or hosting events.
- Connect underserved people with public health resources.
In addition to spreading awareness about behavioral health, people can work to create change at the policy level by doing any of the following:
- Create community classes to educate groups about air quality.
- Work for a government agency that implements public health policies.
- Canvass for candidates who are committed to mitigating climate change and pollution.
- Volunteer or work with civic associations at the community level.
For more information about how to get involved, visit any of these government agency websites:
The following section contains tabular data from the graphics in this post.
Air Quality in 2018, by City arrow_upward
Metro Areas with the Lowest Percentage of “Good” AQI Days
| City/Metro | Good Days | Moderate Days | Unhealthy for Sensitive Groups Days | Unhealthy Days | Very Unhealthy Days | Hazardous Days |
|---|---|---|---|---|---|---|
Hilo, HI | 13 | 62 | 64 | 99 | 5 | 0 |
Phoenix-Mesa-Scottsdale, AZ | 18 | 185 | 60 | 5 | 4 | 0 |
Los Angeles-Long Beach-Anaheim, CA | 22 | 116 | 38 | 6 | 0 | 0 |
El Centro, CA | 39 | 108 | 32 | 5 | 2 | 0 |
Riverside-San Bernardino-Ontario, CA | 51 | 141 | 72 | 24 | 5 | 0 |
San Diego-Carlsbad, CA | 56 | 128 | 12 | 0 | 0 | 0 |
Visalia-Porterville, CA | 58 | 99 | 67 | 19 | 0 | 0 |
Denver-Aurora-Lakewood, CO | 68 | 189 | 41 | 6 | 0 | 0 |
Chicago-Naperville-Elgin, IL-IN-WI | 72 | 178 | 19 | 5 | 0 | 0 |
Hanford-Corcoran, CA | 85 | 188 | 27 | 4 | 0 | 0 |
Metro Areas with the Highest Percentage of “Good” AQI Days
| City/Metro | Good Days | Moderate Days | Unhealthy for Sensitive Groups Days | Unhealthy Days | Very Unhealthy Days | Hazardous Days |
|---|---|---|---|---|---|---|
Salem, OR | 60 | 1 | 0 | 0 | 0 | 0 |
Coeur d’Alene, ID | 147 | 1 | 0 | 0 | 0 | 0 |
Longview, WA | 181 | 1 | 0 | 0 | 0 | 0 |
College Station-Bryan, TX | 182 | 0 | 0 | 0 | 0 | 0 |
Monroe, MI | 191 | 1 | 0 | 0 | 0 | 0 |
Bremerton-Silverdale, WA | 202 | 1 | 0 | 0 | 0 | 0 |
Mount Vernon-Anacortes, WA | 208 | 2 | 2 | 0 | 0 | 0 |
Kahului-Wailuku-Lahaina, HI | 236 | 2 | 0 | 0 | 0 | 0 |
Salem, OH | 242 | 1 | 0 | 0 | 0 | 0 |
Ottawa-Peru, IL | 271 | 2 | 0 | 0 | 0 | 0 |
Citation for this content: MPH@UNC, the Gillings School of Global Public Health’s online MPH program